Monthly Revenue Growth and Product Performance Dashboard
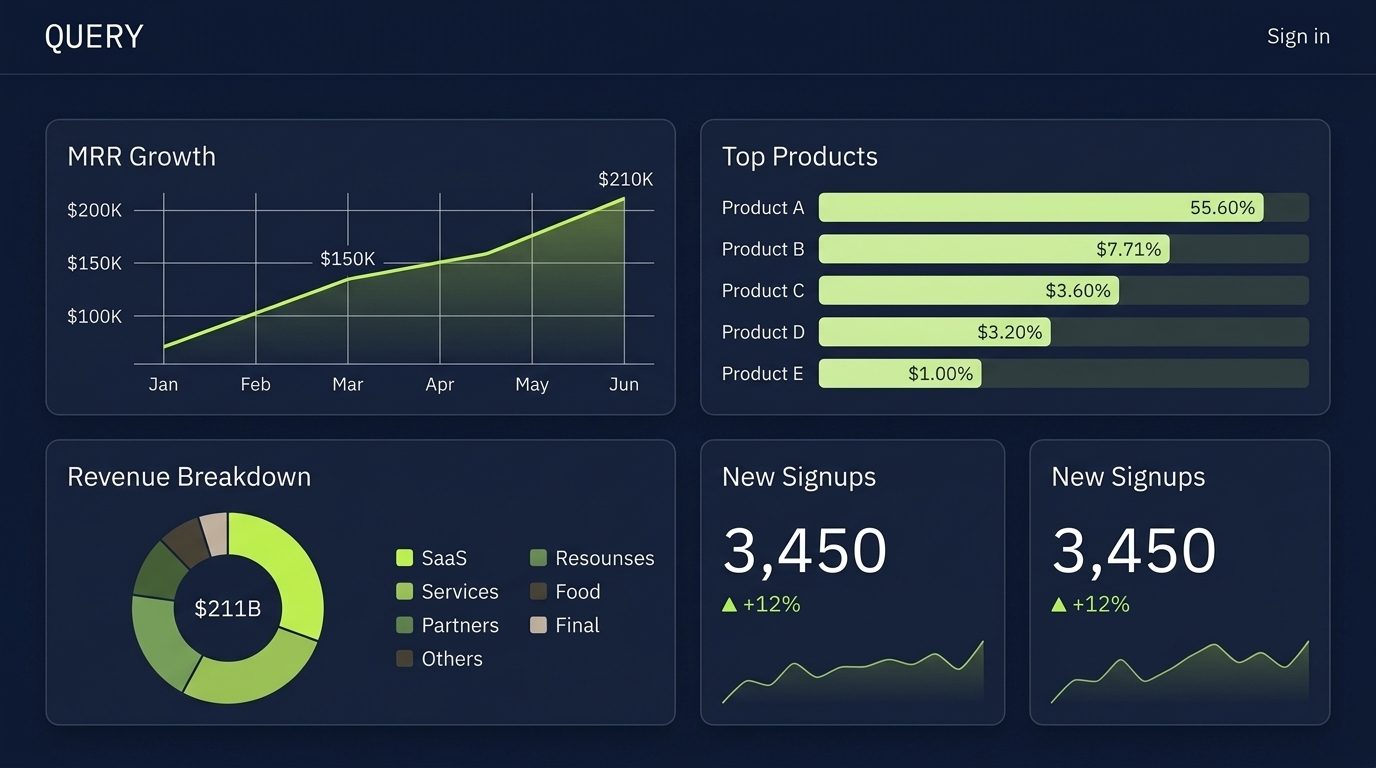
A data visualization dashboard showcasing MRR growth from January to June, highlighting top products by percentage and revenue breakdown across various sectors.
shortodella
png
Free license
A data visualization dashboard showcasing MRR growth from January to June, highlighting top products by percentage and revenue breakdown across various sectors.